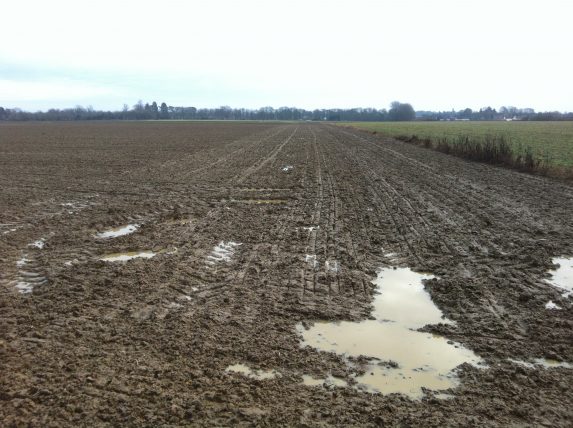
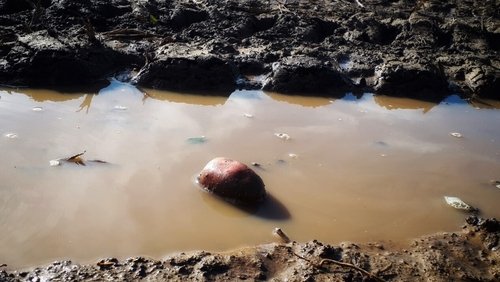
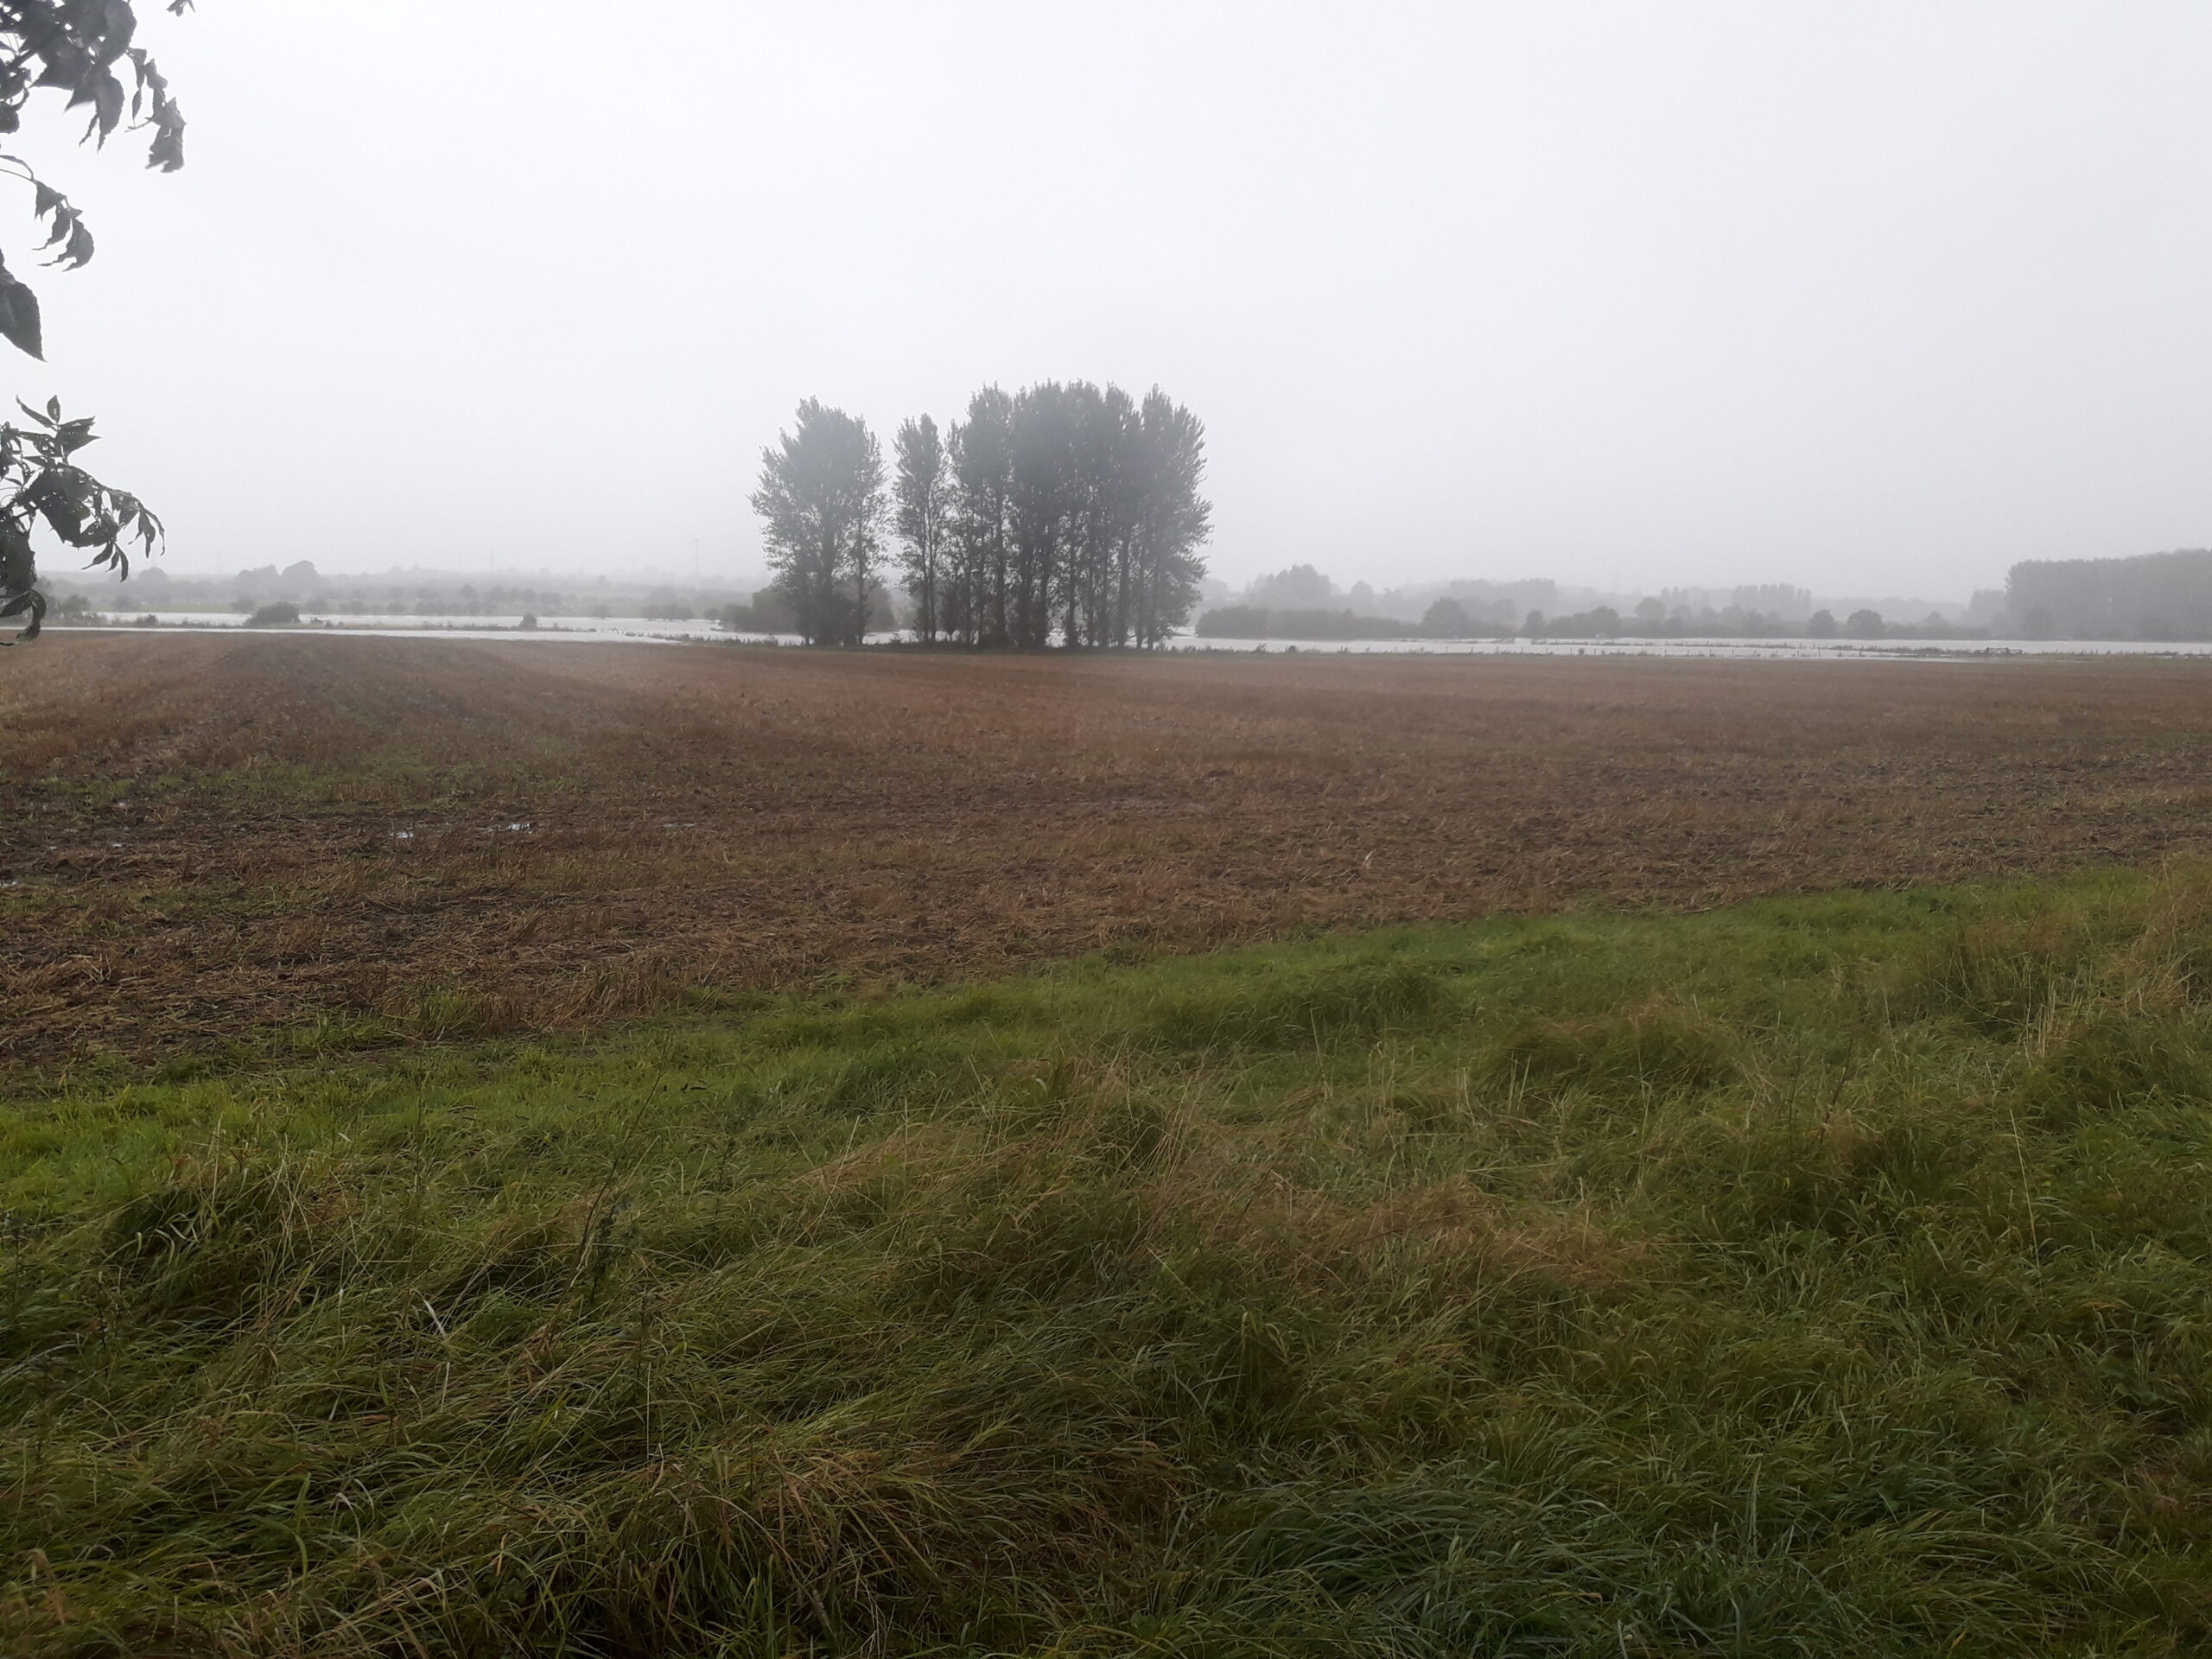
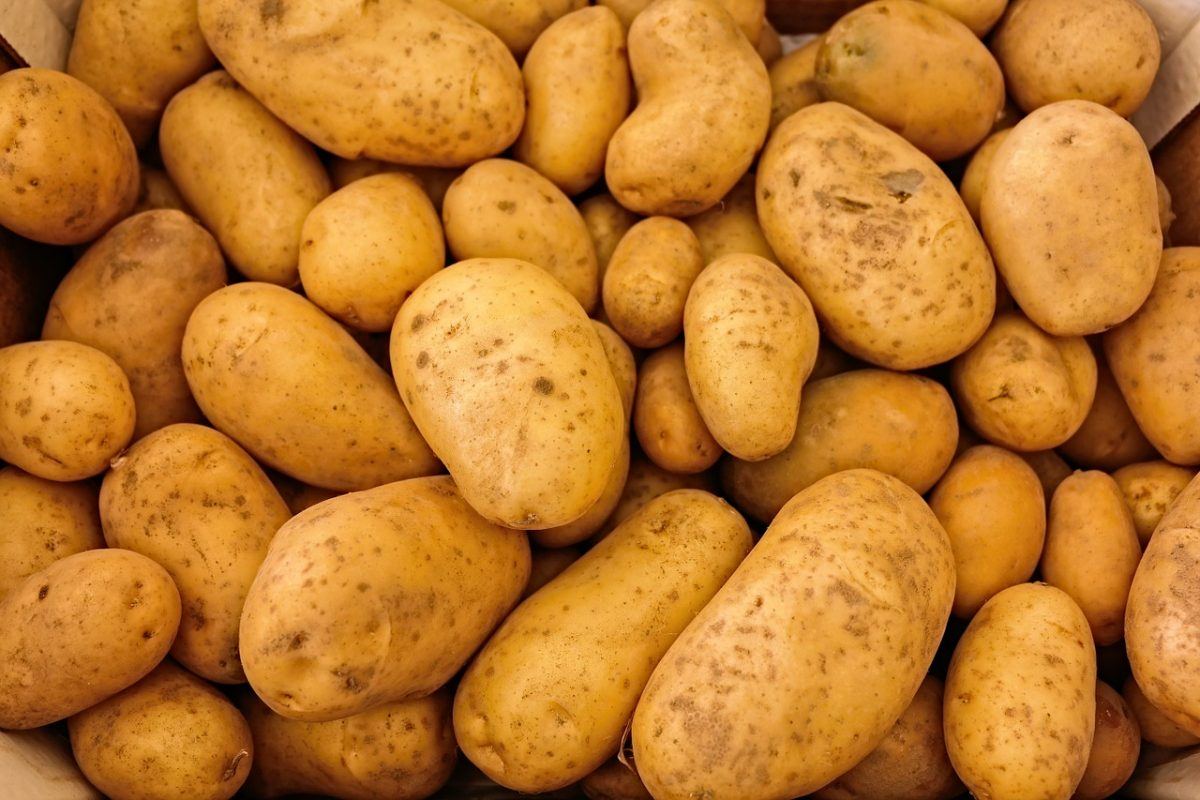
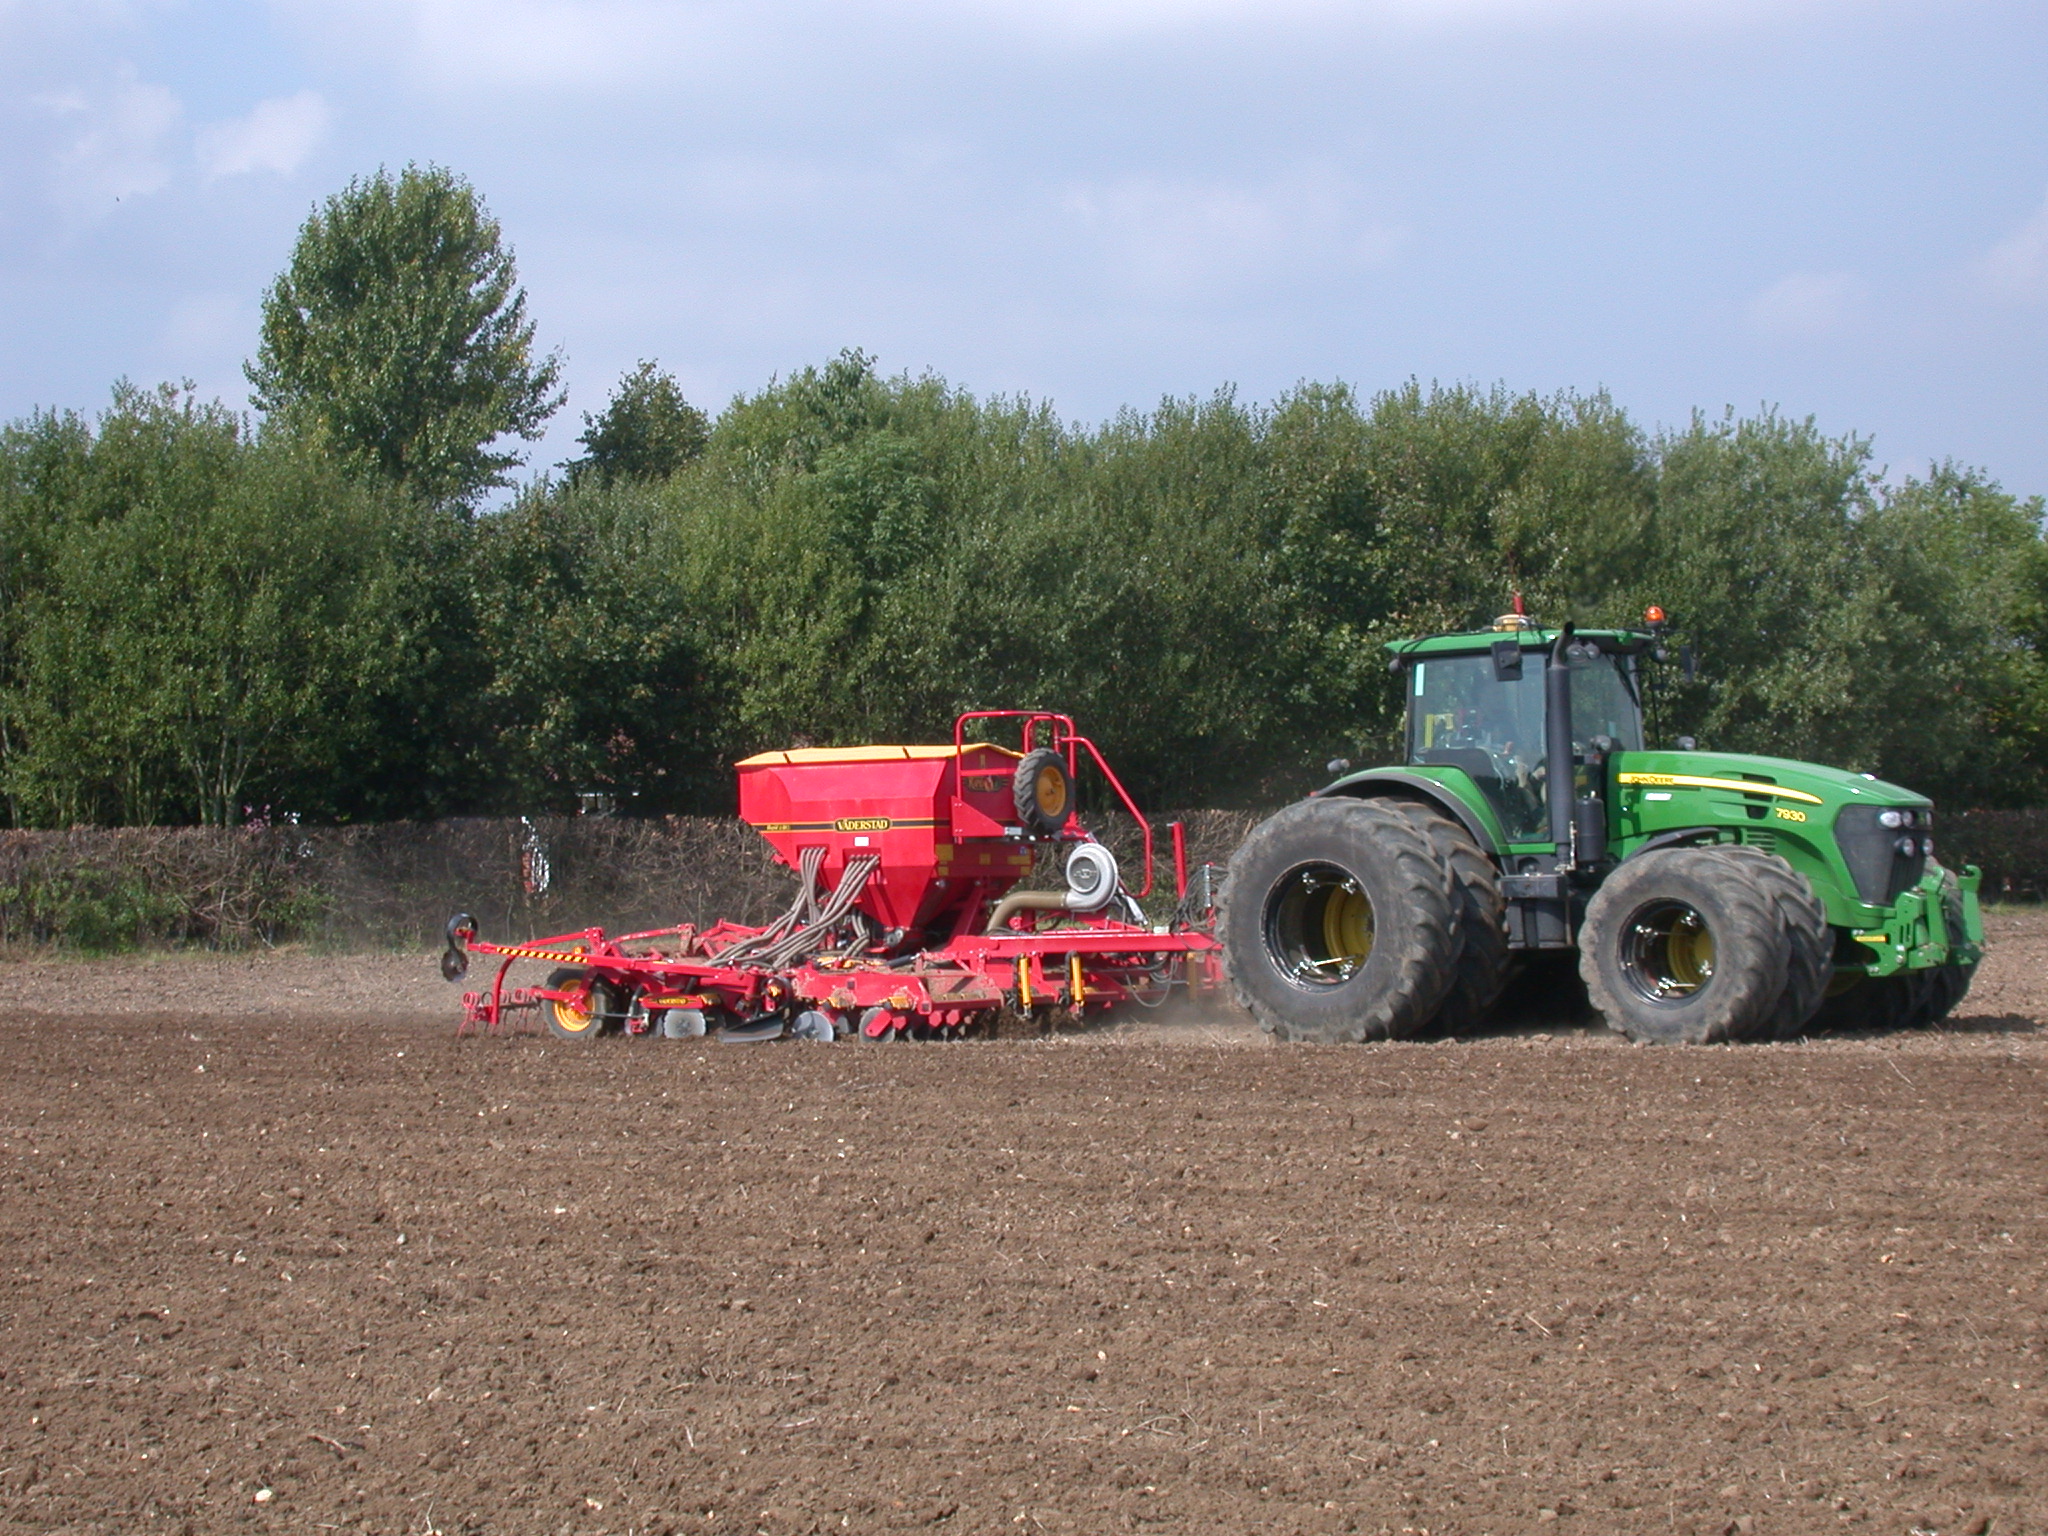
Like many real-life farms across the country, Andersons’ Loam Farm is also having to deal with the effects of the very wet autumn. This has led to budgets for harvest 2020 being reworked to accommodate more spring planting. Of the usual 300 hectares of wheat that this farm plants each autumn it has been assumed that half will not get in. The farm is planning to grow 150 Ha of spring barley instead. The resulting figures are shown in the table below – figures for the past two harvest are shown along with the pre-rain budget for 2020 and then the current one.
| Loam Farm Model – source The Andersons Centre | ||||
| £/Ha Harvest Year – |
2018* |
2019~ | 2020#
(Initial) |
2020# (Revised) |
| Output |
1,205 |
1,237 | 1,217 |
1,094 |
| Variable Costs |
403 |
439 | 457 |
411 |
| Gross Margin |
802 |
798 | 760 |
683 |
| Overheads |
421 |
442 | 443 |
443 |
| Rent & Finance |
242 |
239 | 238 |
238 |
| Drawings |
79 |
79 | 79 |
79 |
| Margin from Production |
61 |
38 | 0 |
(77) |
| Basic Payment |
228 |
230 | 219 |
220 |
| Business Surplus |
289 |
268 | 219 |
143 |
* result ~ estimated # budget
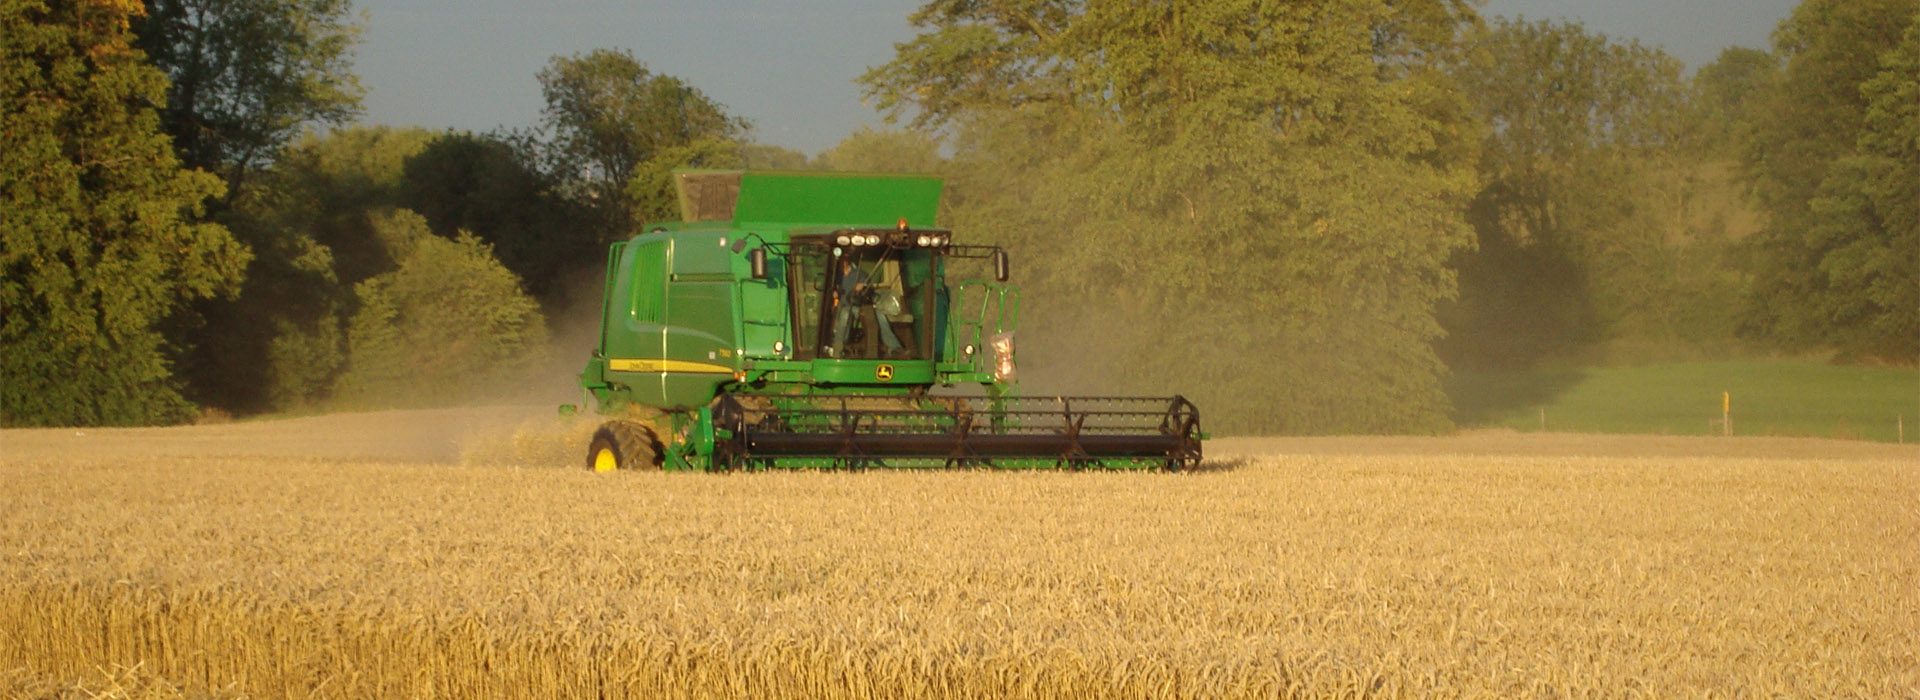
It can be seen that profitability was forecast to decline for the coming harvest anyway. This was partly as a result of yields reverting to the mean after the wheat and beans produced higher-than-average figures for the previous harvest. But costs were also projected to rise for the present cropping year.
With the farm now planning to grow a substantial area of spring barley, it can be seen that the overall output drops from the original budget as the revenue from the crop will not be as large as from winter wheat (despite some malting premium being assumed). Output has also been reduced by the forecast oilseed rape yield being decreased – some of Loam Farm’s OSR crops are looking sickly in the wet ground. Variable costs decrease as spring barley is a cheaper crop to grow. No change has been made to overheads as it is assumed that cost structures will not change in the short-term.
Overall, the wet autumn means that profitability looks set to be reduced compared with initial estimates. However, the change is not massive, which highlights the fact that spring crops don’t always affect overall performance too much if they are done well, simply because of how expensive it is becoming to grow winter crops.
Loam Farm is a notional business, located in East Anglia, which has been running since 1991 and tracks the fortunes of arable farming. It comprises a 600 hectare (1,480 acre) combinable crop farm running a usual rotation of milling wheat, WOSR, feed wheat, and spring beans. Of the cropped area, 240 Ha are owned and 360 Ha rented on FBTs. There is a working proprietor plus one full-time man and harvest casual.