Negotiations between the UK and the EU on making amendments to the Northern Ireland (NI) Protocol have dominated the trade agenda in recent weeks. There have been promising signs of progress, although significant hurdles need to be overcome if an agreement is to be reached by April (to coincide with the 25th anniversary of the Belfast Good Friday Agreement).
The announcement, on 9th January, of a data sharing agreement between the UK and the EU is key development as it permits the EU to gain real-time access to data on goods movements between Great Britain (GB) and NI. The EU sees this as a critical pre-requisite towards rebuilding trust in UK-EU relations and in permitting the EU to consider introducing greater flexibility in how regulatory checks on goods coming from GB into NI are undertaken. However, this data-sharing agreement is only a first step and there are serious differences to reconcile in other areas.
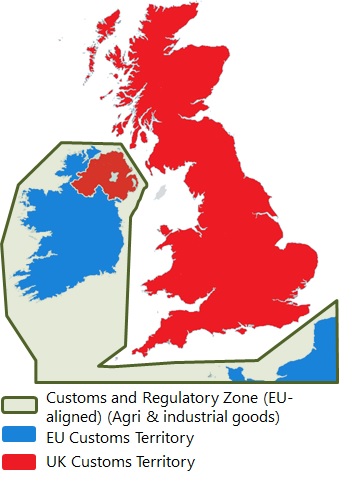
Most notably, an agreement on the levels of Sanitary and Phytosanitary (SPS) and Customs checks on goods remains unresolved. This is especially important for agri-food trade. Previously, the UK had proposed a ‘green channel’ at ports which would permit goods destined to stay in Northern Ireland to be waved through without customs paperwork. A ‘red channel’ would be set-up for shipments destined for the Republic of Ireland. This set-up would be complemented by a Trusted Trader scheme and fines to minimise non-compliance. Such proposals were dismissed by the EU as being insufficient to protect the integrity of its Single Market.
Back in October 2021, the EU proposed an ‘express lane’ for goods destined to stay in NI, although Customs paperwork would still be required. At the time, these proposals were dismissed by both the UK Government and the DUP as being unacceptable because of the border it would create on the Irish Sea which would undermine the integrity of the UK.
The current negotiations are focusing on finding a landing zone between the green channel and express lane approaches. If this conundrum could be resolved, a pathway towards an agreement between the UK Government and the EU should emerge. However, concerns persist as to whether the DUP would accept this. So, whilst the mood music has changed and progress is being made, it remains premature to expect an agreement yet. Talks are likely to continue until April and beyond. What might yet emerge is a ‘fudge’ based on more temporary arrangements similar to the extension of the grace period for checks on veterinary medicines traded between GB and NI agreed last month.
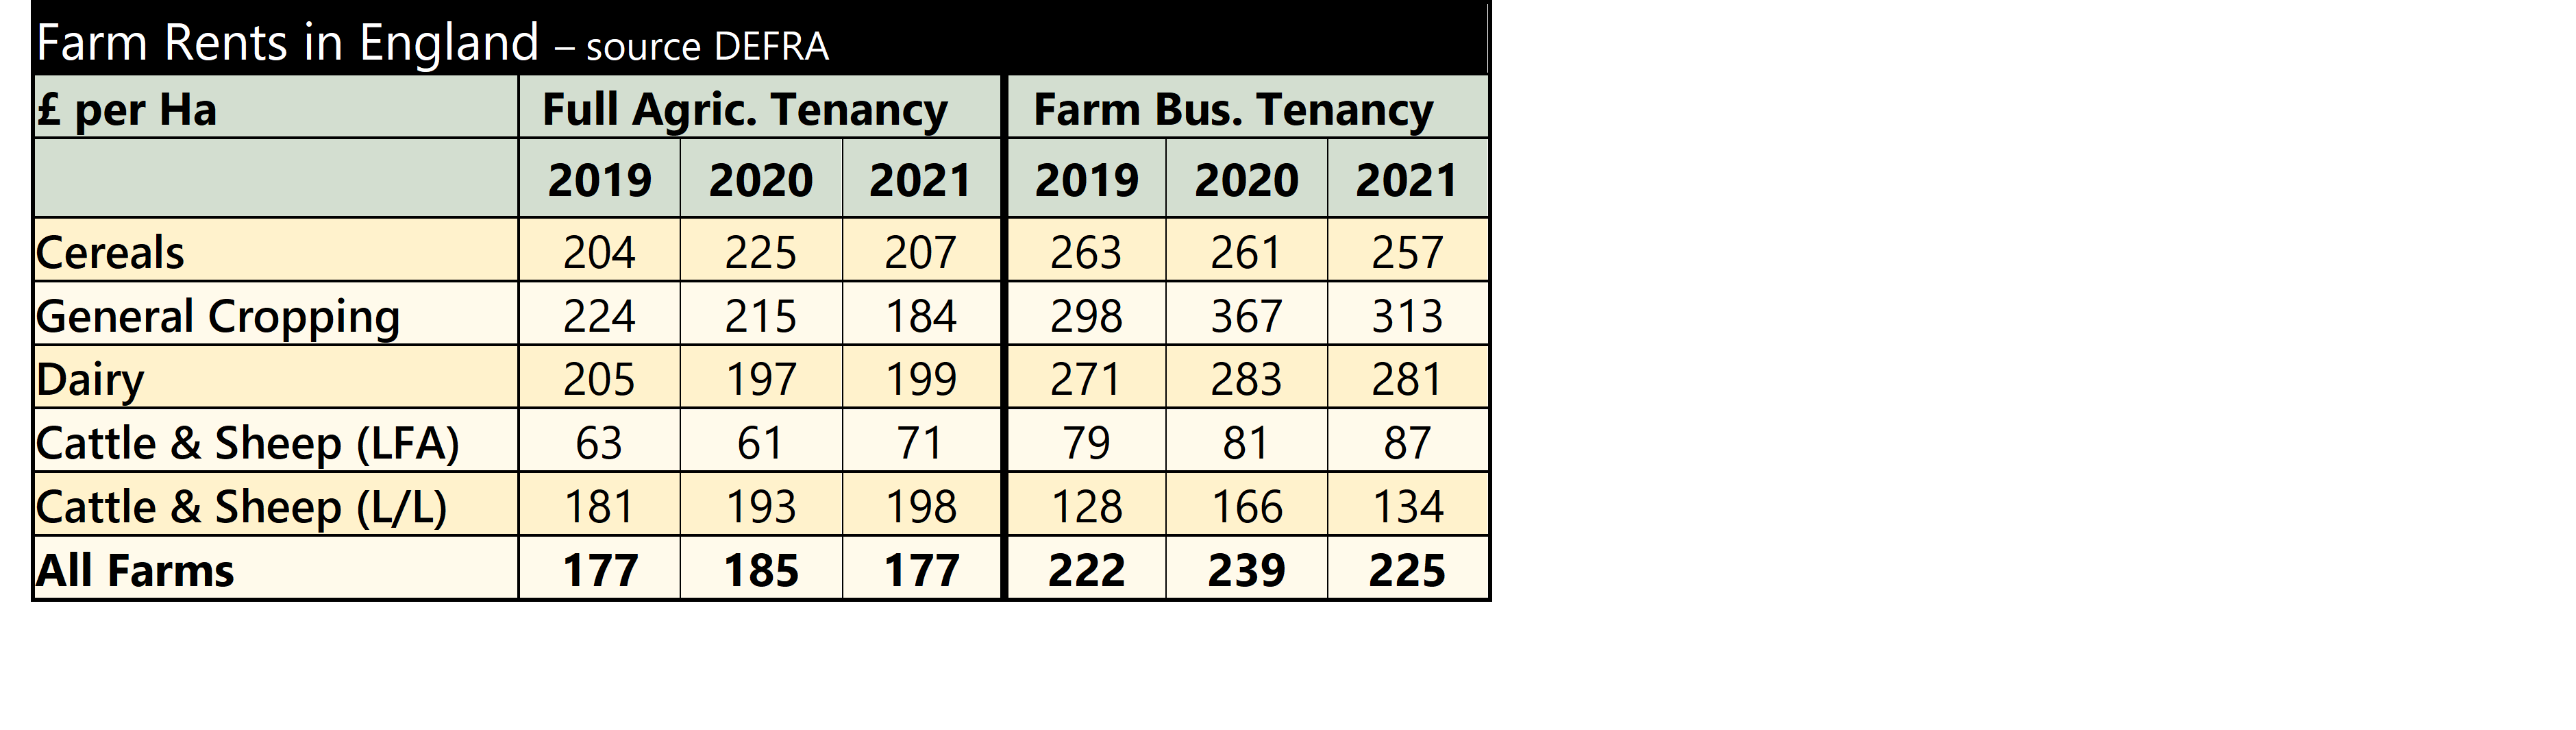 As written previously, data on rents can fluctuate annually and one year’s information should not really be taken in isolation. In general, rents have been on an upward trend, but looking to the future it would be expected that, as the BPS is phased-out, then overall rents will fall.
 Farming Connect Boot Camp